Analyzing Biological Systems with Flow Cytometry
Accurately measuring biological parameters in heterogeneous cell populations, such as tissue samples, can be a challenge. When researchers use traditional bulk methods to analyze their cell samples, they obtain a single readout representing an average over all cells. There is no way to know if a signal came from low to moderate expression of the target throughout the entire population or from a few cells with high expression. Additionally, more abundant cell subpopulations dilute fainter signals. Therefore, bulk cell analyses mask rare phenotypes and events in heterogenous populations.
Beyond Bulk Analysis
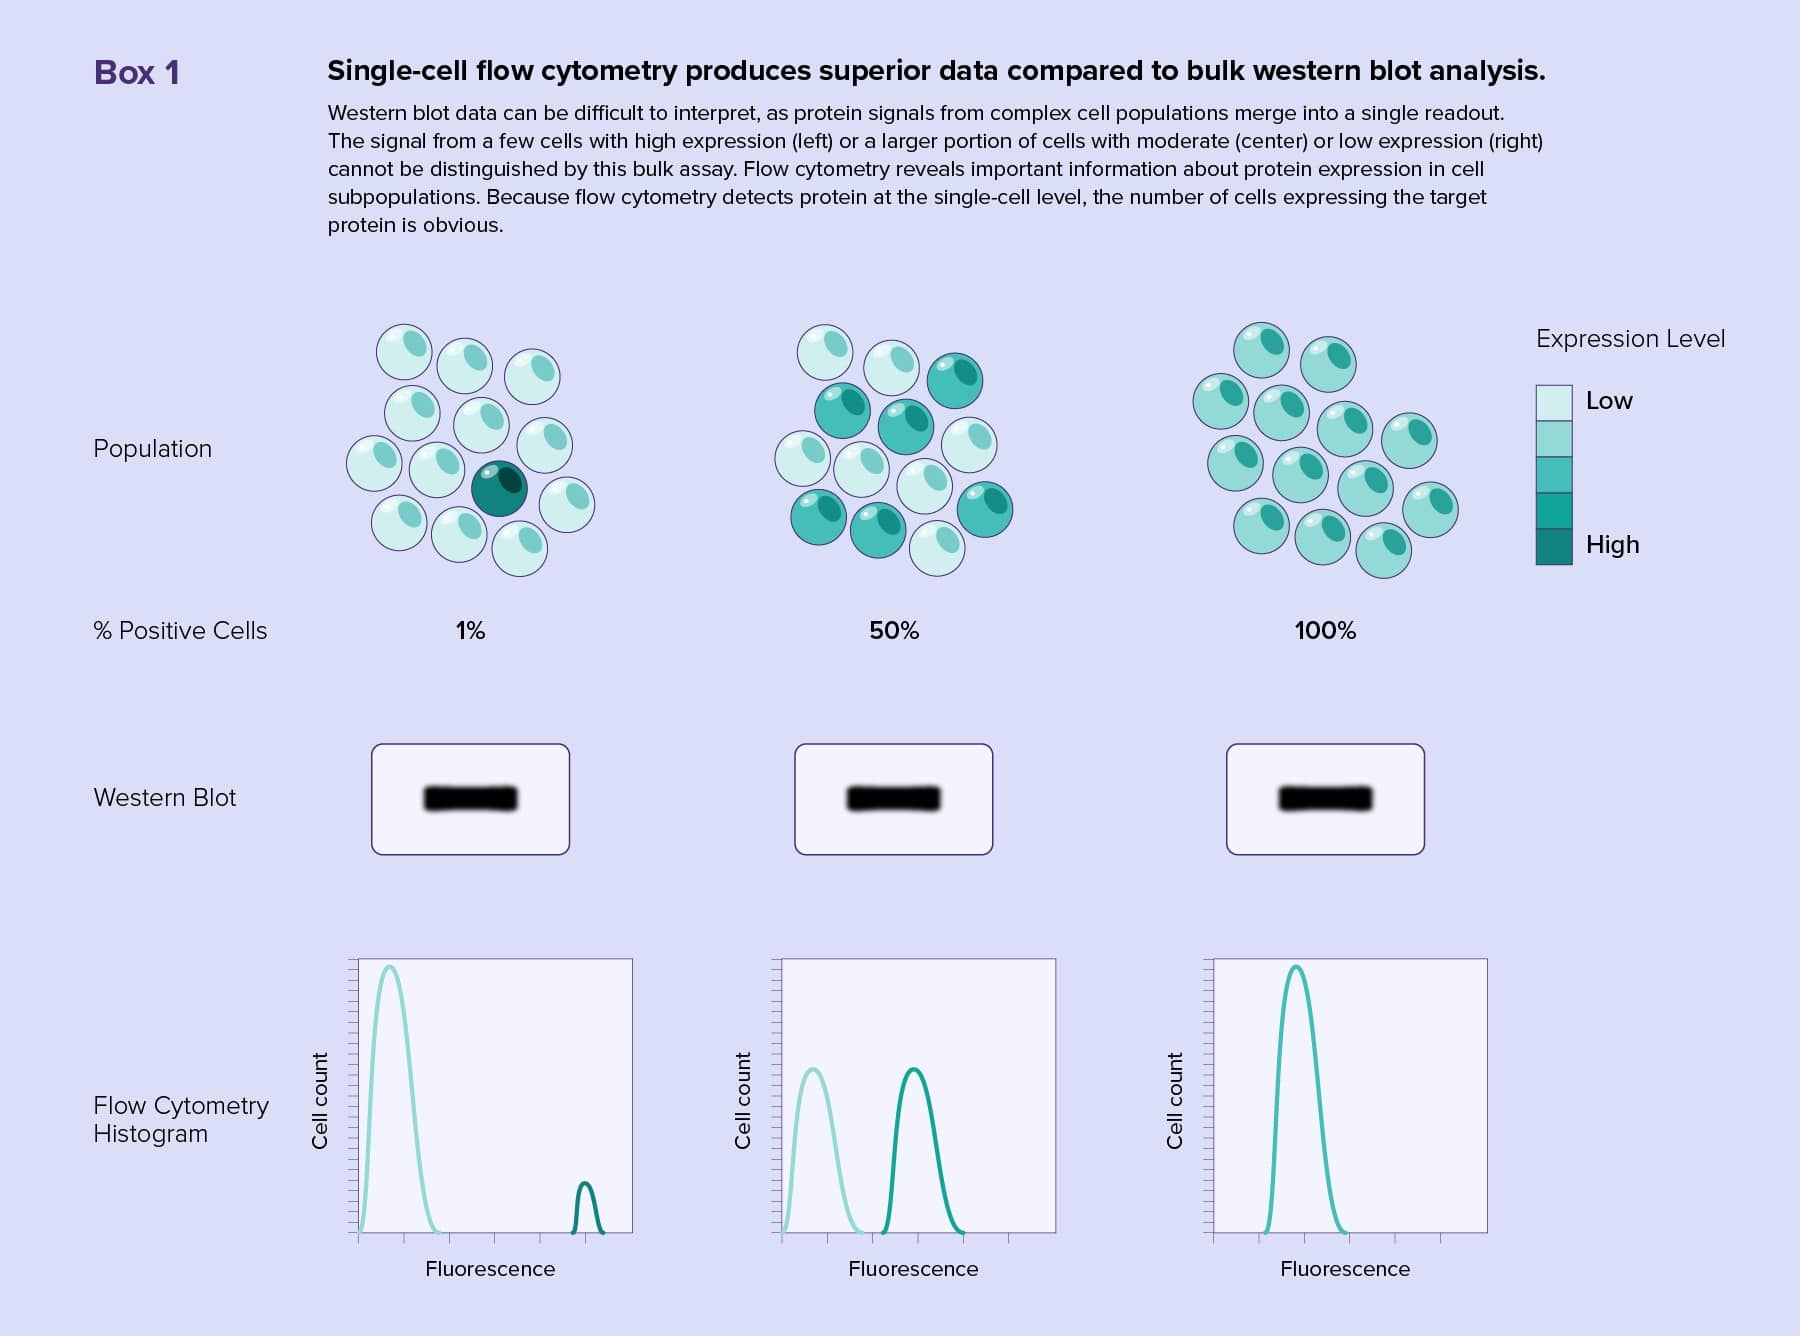
Western blotting is a common bulk method for protein identification. Rather than running bulk samples on a gel and probing membranes, scientists can capture the entire diversity of a cell population by analyzing single cells with flow cytometry.
Flow cytometry enables scientists to track multiple surface or intracellular markers in an experiment by using different fluorescent antibodies or stains. Modern western blots reveal only two or three proteins at a time, and accurately assessing the tissue origin of target proteins from heterogeneous samples is difficult (see Box 1). Multiplexing with flow cytometry produces complex quantitative datasets rich with information, such as cell subtype representation, target protein amounts, and protein activity. Flow cytometers are also capable of separating cells with similar characteristics for further analysis.
For the target protein to be visible during a western blot detection step, researchers must use ample amounts of sample. One of the strengths of flow cytometry is its ability to detect very small amounts of protein, even on single cells. This benefits researchers using precious samples that could run out or require ex vivo expansion when performing multiple western blot analyses.
In an early example of single-cell analysis via flow cytometry, a team of researchers led by Garry Nolan from Stanford University tracked signaling events in patient cancer cells by identifying phosphorylated proteins. 1 Protein phosphorylation controlled by kinase and phosphatase enzymes causes rapid changes within a cell. Mutations in cell signaling and epigenetic changes in gene expression patterns may lead to cancer.2In this study, the researchers measured multiple parameters in 50,000 single cells from 30 acute myeloid leukemia patient specimens. The researchers exposed the patient samples to signaling inputs, such as cytokines, and detected phospho-signaling events with monoclonal antibodies specific to the phosphorylated forms of target proteins. Assaying the samples by western blot would have required two blots for each target protein—one detecting the phosphorylated protein and another detecting total target protein levels.
Based on their data, the researchers linked protein activity to phenotypic outcomes and built millions of cytokine-response networks that correlated signal transduction with patient genetics and disease outcomes. 1 Prior to the advent of multiplex flow cytometry, it was impossible to do a study of this scale. This study enhanced scientists’ understanding of cancer signaling in the heterogeneous tumor microenvironment.
Systems Biology
Researchers often take a holistic view when understanding the biology of their study subject. By measuring multiple parameters using flow cytometry, they can monitor molecular pathways in complex cellular networks. With greater knowledge of biological systems, researchers gain a better understanding of these systems in health and disease.
WITHIN CELLS
The metabolic state of cells informs on many processes, and there are several flow cytometry antibody panels that detect metabolic enzymes, transporters, and phenotypic markers. Beyond proteins, fluorescent molecules taken up, produced, or altered during metabolic reactions grant researchers access to the interior cellular world. Scientists use flow cytometry to detect metabolic changes in immune cells in response to cancer,3 in unculturable pathogenic bacteria from environmental samples, 4 and in cancer stem cells in heterogenous populations.5
The altered metabolism of cancer cells, such as an increase in aerobic glycolysis, promotes their survival and proliferation. 6 Because many drugs target metabolic pathways, scientists can analyze cancer cell metabolism to predict the cellular response to chemotherapy.7 In one example, researchers used flow cytometry to track the auto-fluorescent metabolic cofactors NADH, NADPH (collectively NAD(P)H), and FAD in individual breast cancer cells.8 The ratio of NAD(P)H to FAD is lower in breast cancer cells that respond to treatment compared to those that are resistant. Detecting the fluorescent cofactors with flow cytometry proved to be an effective technique for distinguishing susceptible and resistant cells. Now scientists can analyze cancer cell metabolism in heterogenous tissue samples via flow cytometry to identify subpopulations that are likely to resist therapy.
AMONG CELLS
Thanks to the advent of single-cell techniques, researchers are gaining insights into the tumor microenvironments (TME) of many cancer types. Tumors consist of a heterogeneous mix of cancer and normal cells. Using flow cytometry, researchers can identify the cell types present in the TME and many of their cellular processes, such as cell division, signaling events, and mutations.9
Multiplex flow cytometry is especially useful for researchers studying immune cells, such as tumor infiltrating lymphocytes (TILs). TILs are incredibly diverse and can either turn up or down the immune response to tumor cells. Scientists identify TIL subtypes by analyzing biomarkers on cell surfaces using a technique called immunophenotyping. Scientists now may use standardized antibody panels for flow cytometry immunophenotyping.10 (See Box 2)
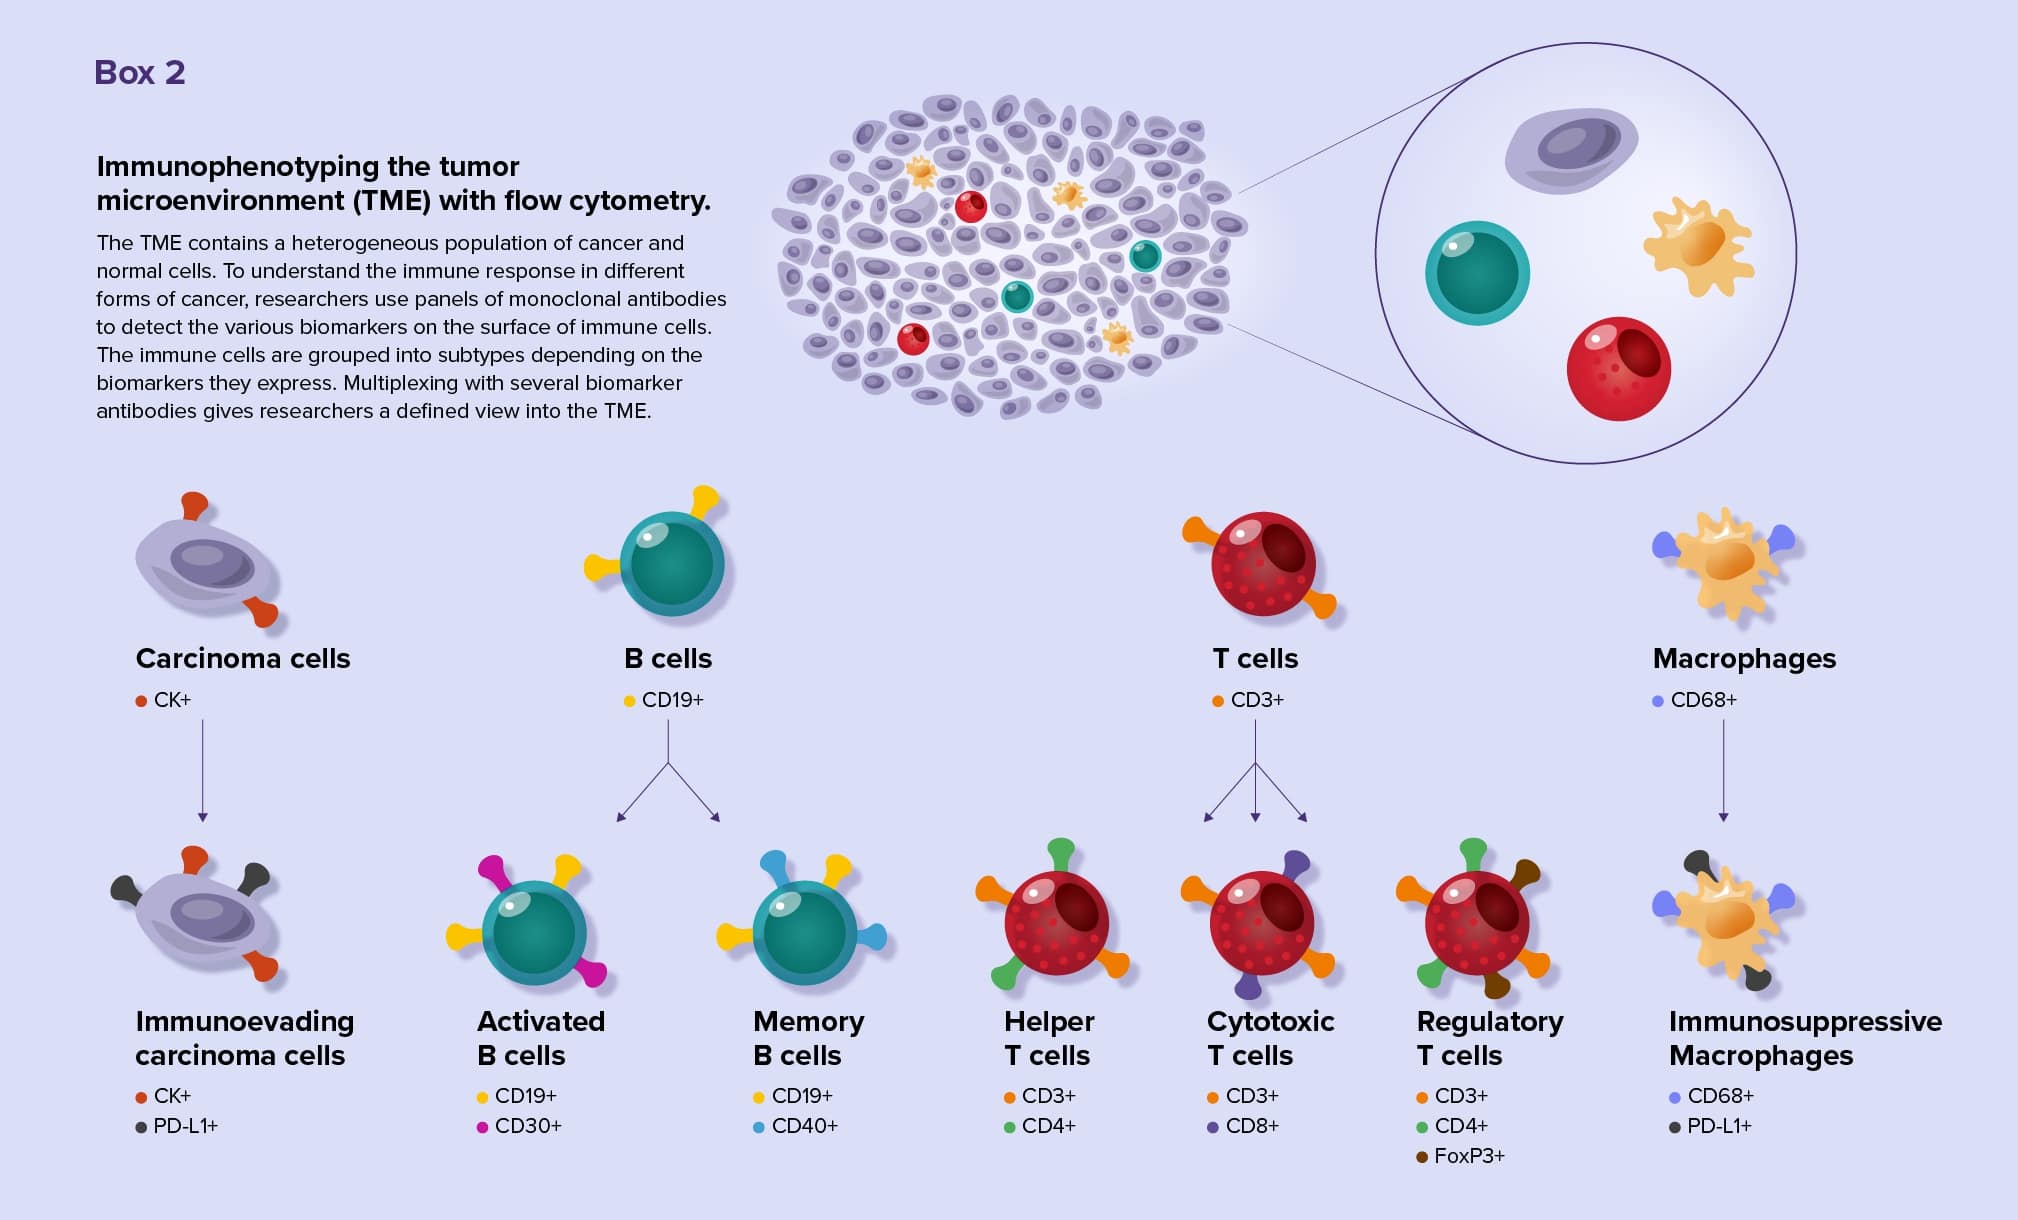
By tracking the biomarkers on each cell, researchers appreciate the different TIL subsets present in a sample and understand the function of those cells. By analyzing biomarkers, they can identify tumor characteristics that allow cancer cells to evade the immune system and locate biomarkers that are associated with poor prognosis.11 Using immunophenotyping techniques, researchers are still discovering new TIL subtypes.12
AMONG ORGANISMS
Scientists gain new perspectives on the environment and human health through microbiome research. The microbe communities that exist on surfaces are complex and dynamic. Because the microbiome influences the health of its human host,13 researchers desire reliable methods to analyze these populations.
Traditionally, scientists analyzed microbial communities using culture methods; however, many microbes are unculturable. While next-generation sequencing of microbiome samples provides vast amounts of taxonomic information, it is far from becoming a routine analysis method. It tends to overestimate the microbial diversity in a population, is not easy to standardize, is costly, and requires analysis by individuals with bioinformatics expertise to sort through the data. 14 Errors in DNA isolation can skew results, minimizing the contribution of species that are more difficult to lyse during sample preparation.
To uncover microbial community dynamics over time, scientists may employ single-cell-based analysis of microbiomes through high resolution flow cytometry or cytometric microbiome profiling. With this technique, scientists measure the forward light scatter of a microbiome sample to determine cell size and stain with fluorescent DAPI to quantitatively measure DNA content. With these two parameters, researchers can resolve over 50 phylogenetically homogenous subpopulations in a microbiome sample in a single experiment.15 Researchers can monitor microbiomes over time and assess them for changes in composition and cell number under different conditions. Additionally, researchers can isolate defined populations using cell sorting to perform additional molecular biology techniques.
References
- Irish JM et al. Single cell profiling of potentiated phospho-protein networks in cancer cells. Cell 2004;118:217-28.
- Hanahan D and RA Weinberg. The hallmarks of cancer. Cell 2000;100:57-70.
- Ahl PJ et al. Met-Flow, a strategy for single-cell metabolic analysis highlights dynamic changes in immune subpopulations. Commun Biol 2020;3:1-15.
- Morishige Y et al. Use of flow cytometry for quantitative analysis of metabolism of viable but non-culturable (VBNC) Salmonella. Biol Pharm Bull 2015;38:1255-64.
- Yuan Y et al. Autofluorescence of NADH is a new biomarker for sorting and characterizing cancer stem cells in human glioma. Stem Cell Res Ther 2019;10:330.
- Liberti, MV and JW Locasale. The Warburg effect: How does it benefit cancer cells? Trends Biochem Sci 2016;41:211-18.
- Zhao Y et al. Targeting cellular metabolism to improve cancer therapeutics. Cell Death Dis 2013;4:e532.
- Shah AT et al. Autofluorescence flow sorting of breast cancer cell metabolism. J Biophotonics 2017;10:1026-33.
- Irish JM et al. Mapping normal and cancer cell signalling networks: towards single-cell proteomics. Nat Rev Cancer 2006;6:146-55.
- Finak G et al. Standardizing flow cytometry immunophenotyping analysis from the Human ImmunoPhenotyping Consortium. Sci Rep 2016;6:20686.
- Costa AFO et al. Role of new immunophenotypic markers on prognostic and overall survival of acute myeloid leukemia: a systematic review and meta-analysis. Sci Rep 2017;7:4138.
- Villani AC et al. Single-cell RNA-seq reveals new types of human blood dendritic cells, monocytes, and progenitors. Science 2017;356.
- Dzutsev A et al. The role of the microbiota in inflammation, carcinogenesis, and cancer therapy. Eur J Immunol 2015;45:17-31.
- Esser C et al. Beyond sequencing: fast and easy microbiome profiling by flow cytometry. Arch Toxicol 2019;93:2703-04.
- Zimmermann Z et al. High-resolution microbiota flow cytometry reveals dynamic colitis-associated changes in fecal bacterial composition. Eur J Immunol 2016;46:1300-03.
